40 FASCINATING MOBILE APP INDUSTRY STATISTICS [2023]: THE SUCCESS OF MOBILE APPS IN THE U.S.
The news contents the Source of the article and credits to Zippia
Research Summary. From checking Facebook to playing games to creating that Disney World itinerary on Canva, mobile apps are a regular part of the average American’s life. The fact is that mobile apps have grown immensely in popularity and value since their invention over a decade ago. With that in mind, our extensive research shows that:
- There are over 5.7 million apps on the Google Play Store and Apple App Store combined.
- There are over 2.2 million apps on the Apple App Store alone.
- The average American has 80 apps downloaded on their phone.
- The average smartphone owner uses 9-10 apps per day and 30 per month.
- 85% of time spent on smartphones is spent using apps.
- There were 255 billion app downloads worldwide in 2020.
- The Apple App Store and Google Play Store made a combined $111 billion in 2021.
- Since 2016, the number of apps downloaded per year has increased by 63%.
For further analysis, we broke down the data in the following ways:
App Users | Smartphone Users | Trends and Projections | User Retention | App Type | Popular Apps | Apple Apple Store vs. Google Play Store
GENERAL MOBILE APP INDUSTRY STATISTICS
Incredibly common in the U.S. and worldwide, we’re spending more and more time on mobile apps. How pervasive are mobile apps? Well, our extensive research shows that, in general:
-
- Between 2019-2020, there were over 250 million apps downloaded daily.That equates to over 91 billion apps downloaded each year, and that number is only expected to increase. By 2024, there could be as many as 500 million apps downloaded every day (184 billion by the end of the year), double that in 2020.
- 98% of Google Play’s revenue comes from free apps.While free apps don’t cost anything to download, they’re still a form of marketing and can make money through advertisements. Companies like McDonald’s regularly make gaming apps for children with the sole purpose of marketing their brand. In that way, free apps and advertisements are surprisingly useful for generating revenue.
- The global consumer spending on apps reached $129 billion as of 2022.That is a huge number, but it’s also a slight decrease from the year prior. Consumers spent roughly $133 billion on apps in 2021, meaning that consumer spending has decreased 3% in only one year.
GLOBAL APP REVENUE 2016-2022
| Year | Total App Revenue (in billions USD) | iOS App Revenue | Google Play App Revenue |
|---|---|---|---|
| 2022 | $129 | $86.80 | $42.3 |
| 2021 | $133 | $85.10 | $47.90 |
| 2020 | $111 | $72.30 | $38.60 |
| 2019 | $89 | $58.40 | $30.60 |
| 2018 | $71.30 | $46.60 | $24.80 |
| 2017 | $58.10 | $38.50 | $21.20 |
| 2016 | $43.50 | $28.60 | $15 |
- By the end of 2022, consumer app spending is expected to reach $170 billion.That’s a projected 27.8% increase in consumer spending in 2021. Plus, consumer app spending is expected to grow larger by 2025. By 2025, consumer app spending may reach over $270 billion.

- By 2023, mobile apps are projected to generate at least $935 billion in revenue.For context, the industry generated $462 billion in 2019, meaning that in only 4-5 years, mobile app revenue will more than double. Most of this money will come from advertisements, but paid downloads will also generate a good portion.
MOBILE APP INDUSTRY STATISTICS BY APP USERS
While the mobile app industry reaps the financial benefits of their products, they wouldn’t be able to do so if people didn’t download them. After all, it’s hard to find someone that doesn’t use mobile apps nowadays. Overall, when it comes to mobile app users, our research shows that:
- The average user engages with 30 apps per month.In total, that equates to around two-thirds or more of the apps installed on the average consumer’s phone. Users also typically use at least 9-10 apps per day, therefore creating the 30:10 rule (30 apps in a month, 10 per day).
- 51% of smartphone users check their apps 1-10 times per day.While that’s the majority of those surveyed, another 25% of users check their apps 11–20 times per day, 16% check 21-50 times per day, and 7% admit to opening apps more than 51 times every day.
- 85% of the time spent on smartphones is spent using apps.However, this time is not divided evenly across all apps. For example, Facebook alone makes up 13% of U.S. minutes spent on apps, and Google follows at 12%. In fact, Google, Facebook, Amazon, and Apple alone account for just over 30% of the time people spend on apps.

-
MOBILE APP INDUSTRY STATISTICS BY SMARTPHONE USERS
Mobile apps wouldn’t exist without smartphones, and just like the mobile app industry, the use of smartphones is also on the rise. Smartphone usage and mobile app usage go hand-in-hand. Here are the facts:
- There are roughly 6.65 billion smartphone users worldwide as of 2022.That’s 86% of the global population. Since 2016, the number of smartphone users worldwide has grown by 50%, from only 3.67 billion (45% of the total population at the time). And this growth is only expected to continue, projected to reach 7.52 billion smartphone users by 2026.
- The average American will check their phone once every 10-12 minutes.That means Americans check their phone at least 96 times per day. Though, statistically, that number is much higher, as 66% of Americans actually check their phones 160 times every day.
- The average American spends at least 5 hours on their phone per day.More specifically, just under half of all Americans spend between 5-6 hours on their phones per day, while a further 22% spend 3-4 hours on average on their phone daily. Believe it or not, less than 5% of Americans spend less than an hour on their phone per day.
- 62% of smartphone users won’t download an app to continue a transaction.And even of the 38% who will, half say that they would simply uninstall and delete the new app after their purchase is complete.
- Americans still spend 1.87% more time on desktops than mobile.While mobile devices are more popular worldwide, Americans still slightly prefer their computers. Overall, spend an average of 3 hours 34 minutes on desktop and 3 hours and 30 minutes on mobile devices.
MOBILE APP INDUSTRY STATISTICS BY TRENDS AND PROJECTIONS
Mobile app usage has been trending upwards for many years, and all signs point to continued growth. With that in mind, here are some facts about mobile app industry trends and projections:
- Mobile app revenue is expected to reach $201 billion by 2023.With a CAGR of 19.5%, mobile app revenue is experiencing impressive year-over-year growth. By 2025, consumer app spending may reach over $270 billion.
- From 2020 to 2021, installs of shopping apps increased by 10% globally.Further, usage of these apps has increased at an even more telling rate, 30% year-over-year. Overall, more and more people are using apps like Amazon, Walmart, SHEIN, and more for their shopping.
- TikTok is the most downloaded app in 2022, with over 104 million downloads in February alone.In January 2021, that number was 62 million downloads, which means the number of downloads increased by 46%. Further, in 2021 alone, TikTok amassed over 2 billion downloads globally.
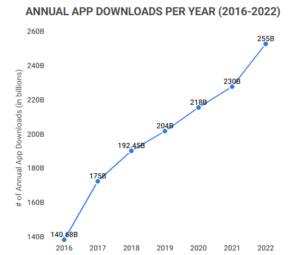
- From 2016 to 2021, yearly global app downloads increased by 63.5%.In 2016 there were 140.68 billion app downloads across the globe. That might seem like a lot, but downloads have actually risen to 230 billion in 2021. That’s an increase of nearly 90 billion apps downloaded per year.
- From 2016 to 2021, app downloads have experienced an average year-over-year growth rate of 10.56%.Though, year-over-year growth can vary. The most impressive growth rate was 24.4% between 2016 and 2017 when app downloads grew from 140 billion per year to 175 billion. By contrast, the years that followed experience growth rates between 5-10%.
- Business app downloads increased by 102% in 2020.The COVID-19 pandemic profoundly affected the way we work and, in turn, increased the number of business apps downloaded. In March of 2020 alone, business apps saw a massive 225% spike in downloads.
MOBILE APP INDUSTRY STATISTICS BY USER RETENTION
With so many mobile apps to choose from, companies are always trying to find ways to improve user retention. Overall, when it comes to user trends and preferences and the way they affect retention, here are some insights our research uncovered:
-
- 50.6% of users will uninstall an app if it takes up too much memory on their phone.If you’ve ever played a massive video game like Red Dead Redemption II, you know the pain of not being able to fit anything on your hard drive. Mobile apps work similarly, as consumers will be less likely to keep an app on their phone if it’s too large and they’re looking to free up memory on their phone.
- 71% of app users churn after three months.Rather than simply accounting for the number of uninstalls, the churn rate accounts for any form of abandonment. With that in mind, nearly three-fourths of all app users worldwide will stop engaging with or uninstall an app within three months of downloading it.
- 62% of people uninstall an app if they experience crashes, freezes, or other major errors.Companies must avoid app crashes and errors, as they can have a major negative effect. Retention will worsen, and past users will be far more likely to leave negative reviews.
- 25% of users will abandon apps simply because they take too long to load or download.Ideally, mobile apps should take no longer than 4 seconds to load if it wants to maintain user retention. Any longer, and users may abandon or uninstall the app.
- After 30 days, app retention is highest for Ecommerce & Retail apps, at 39%.That includes apps like Amazon, Etsy, and many more. Most users find these apps useful over a long period, making them less likely to be uninstalled.
Of course, if there’s a best, there’s also a worst, and 30-day retention is the lowest for Social Networking apps. This might be surprising, given that Facebook and other major social media sites dominate the time spent on apps, but many smaller social media apps see very high churn.
RETENTION RATE BY TYPE OF APP
Type of Mobile App 30 Day Retention Rate 60 Day Retention Rate 90 Day Retention Rate Media & Entertainment 37% 27% 22% Ecommerce & Retail 39% 27% 22% Travel & Lifestyle 38% 28% 23% Business & Technology 34% 23% 17% Social Networking 30% 20% 16% - After 90 days, app retention is highest for Travel & Lifestyle apps, which maintain a retention rate of 23%.While that’s a 39.5% decrease in retention from the 30-day rate of these apps, it’s still more than any other type of app by the 90-day mark. Once again, Social Networking apps score low here, with a 90-day retention rate of only 16%.
- 47% of apps need more time for testing.For anything from bugs to security, nearly half of all apps released to the market are wholly unprepared to meet consumers. Believe it or not, 75% of mobile applications will fail basic security tests. Yikes.
- 54% of marketers use mobile apps to market to their customers.Though this is over half, it’s still a surprisingly low percentage given the benefits. After all, half of all users say they’ve discovered a new company or product when searching and using apps on their smartphones.
MOBILE APP INDUSTRY STATISTICS BY APP TYPE
The mobile app industry is diverse, as not all apps serve the same purpose. From apps that tell you the weather to the latest in popular games, here are some of the facts about different types of apps:
- 50% of app users mainly use apps for communication.Messengers and social media are a huge part of what makes apps so popular. For example, 40% of smartphone owners determined that social media apps are their most frequently used type of app, and 10% said the same about messaging apps.